Back
Your Parts Counter and Sales Floor Are Stocking for Different Riders
By Erik Smith, Sr. Product Operations Analyst, One Dealer Lane | Approximately 7-minute read
October 6, 2026
Share:
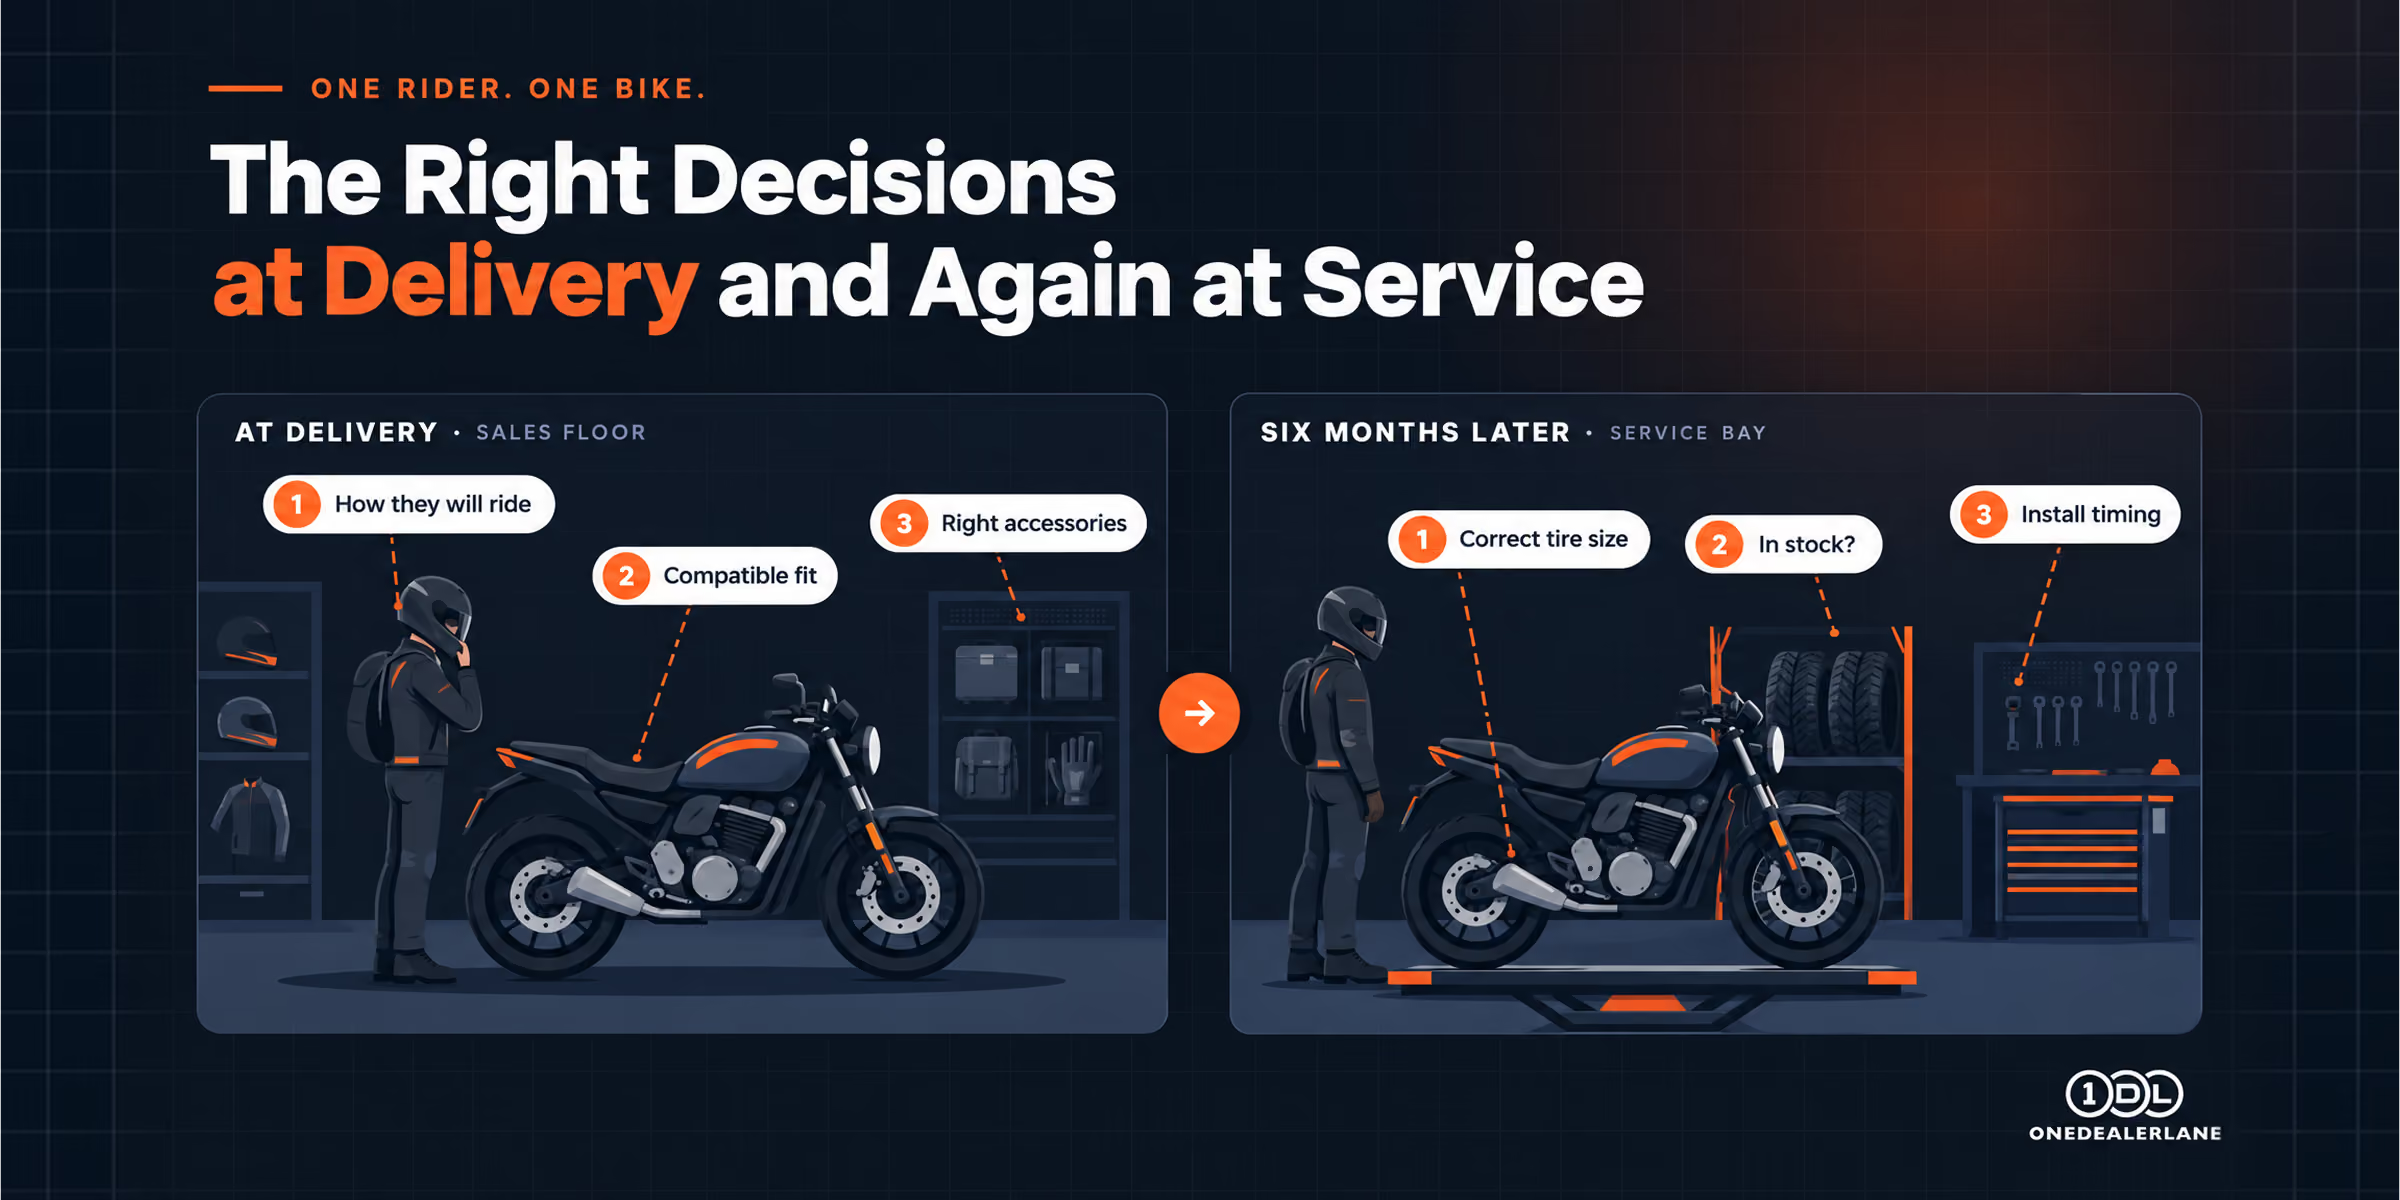
The accessories customers choose at delivery are not necessarily the parts they need in service. One storewide stocking rule misses the difference.
Key takeaways
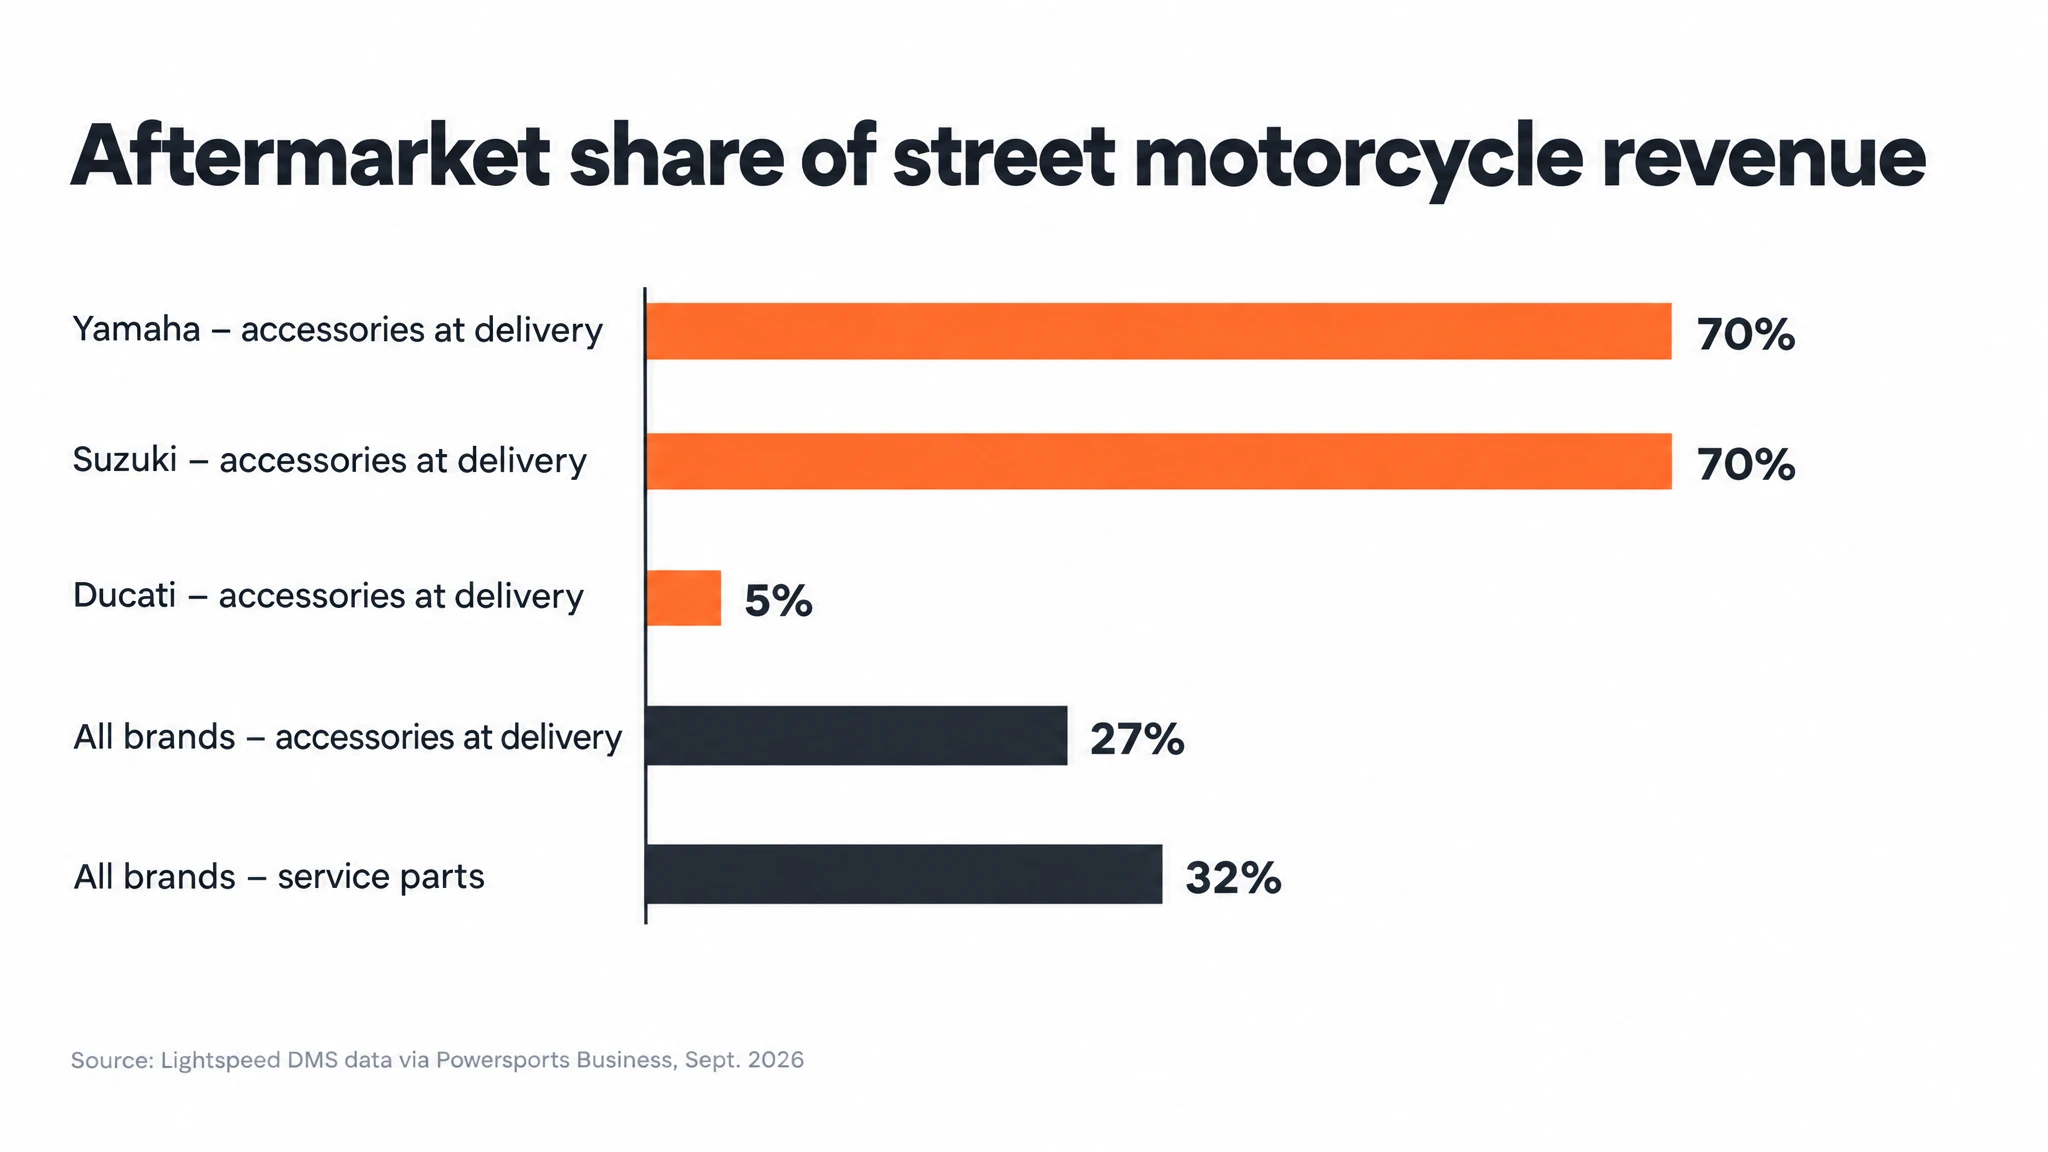
Brand decides the delivery conversation. About 70% of Yamaha and Suzuki street accessory revenue at delivery is aftermarket; on Ducati it is about 5% (Lightspeed DMS data via Powersports Business, Sept. 2026).
Service skews more aftermarket than sales. Aftermarket takes about 32% of street service-parts revenue vs. 27% at delivery, and tires, mostly aftermarket, are about 25% of street service-parts revenue (PSB).
This is a gross decision. Parts, service and accessories produced $24.2 million of RideNow Group's $84.8 million powersports gross profit in Q2 2026 (SEC filing).
The short answer: one storewide OE-versus-aftermarket target is the wrong tool. In Lightspeed's data, aftermarket is 27% of street accessory revenue at delivery but 32% of street service-parts revenue, and the split swings from roughly 70% to 5% depending on the franchise. Stock and present by brand, season and job, not by department average.
A customer buys a new motorcycle and asks what should go on it before delivery. Six months later, the same bike comes back for tires and routine service. Those are two chances to help the same rider, and they call for different shelves, different conversations and sometimes different suppliers. So why do so many stores manage both with one accessories target?
One store, two different demand patterns
Lightspeed DMS data from motorcycle dealerships, published by Powersports Business, makes the contrast visible. Aftermarket accounts for about 27% of street accessory revenue at delivery but 32% of street service-parts revenue. Off-road, the shares are 37% and 41%. Those are shares of revenue, not margin. Revenue share does not tell you which product made more money.
Part of the gap is brand mix. Harley-Davidson alone accounts for 36% of street service-parts revenue at just 26% aftermarket; set it aside and the street service figure rises to 36%. Geography matters too. Earlier Lightspeed over-the-counter data put metric-market aftermarket share at 29% nationally but 43% in the Northwest (Powersports Business, Dec. 2024; that study counted parts by quantity, so treat it as directional context, not a like-for-like comparison).
Why it matters: at RideNow Group, the largest U.S. powersports retail group, parts, service and accessories brought in $50.1 million of revenue against $25.9 million in cost during Q2 2026, and produced $24.2 million of its $84.8 million powersports gross profit (Q2 2026 results). Getting the mix wrong is not a stocking nuisance. It is roughly a quarter of the gross line.
Brand decides what you present at delivery
The storewide average hides the real story. On Yamaha and Suzuki street bikes, about 70% of accessory revenue at delivery is aftermarket; off-road Kawasaki and Yamaha run 67% and 65%. Ducati is about 5% on the street, and BMW, Triumph and Ducati are all in single digits off-road (PSB). Same showroom, completely different accessory business depending on the franchise.
So the delivery conversation has to be model-specific. Ask how the customer will ride, show a few compatible options that improve that use, and state installed price and any effect on coverage. On warranty, be accurate: per FTC guidance on vehicle warranties, using an aftermarket part does not void the warranty, and the manufacturer must prove an aftermarket part caused damage before denying coverage. A defective or badly installed part can still cost coverage for what it damages. Confirm the specific OEM's terms.
Record what was offered, chosen or deferred. A deferred item is a natural first-service conversation, not permission to push the same bundle on every buyer. It is the same discipline that lifts F&I gross per unit: present every customer a structured, relevant set of options, the way a digital F&I menu presents protection products, instead of whatever the salesperson remembers to mention.
Season and job decide the service shelf
In the service bay, the mix follows the work. Tires are the single largest service category, about 25% of street service-parts revenue and 22% off-road, and they are overwhelmingly aftermarket. Engine, body, electrical and oil revenue stays roughly 80% to 97% OE (PSB).
The calendar moves the ratio. Body work climbs from about 7% of street service-parts revenue in season to 13% between November and January, at roughly 3% aftermarket. In season, the mix tilts back toward wear items the aftermarket dominates. And the direction is clear: in April through June, aftermarket took 38.7% of street service-parts revenue, up from 34.9% a year earlier, the highest quarter in the series. Buying for tire season and buying for winter rebuilds are two different purchase orders.
Use actual repair orders to see which products technicians request, which jobs wait on parts and which alternatives customers accept. Watch for a hidden fill-rate leak, too: the same physical part often lives in the DMS under several distributor part numbers, so the counter turns customers away for parts that are on the shelf (Motorcycle & Powersports News).
The right product mix follows the rider and the job, not a storewide percentage. — One Dealer Lane
The scorecard: six numbers by brand and model
Metric
What it tells you
Where it lives
Accessory offer rate
Did the customer see options at all?
Deal/delivery record
Accessory attachment
What was chosen vs. deferred
Deal/delivery record
Service-parts demand by category
Tires vs. rebuild vs. maintenance mix
Repair orders
Fill rate
Jobs delayed or customers turned away for parts
Parts counter / DMS
Installed gross
Profit after cost and labor, not revenue share
Parts + service P&L
Aging
Stock bought for the wrong franchise or season
Parts inventory report
Revenue mix alone cannot tell you which product is more profitable. Cost, labor and returns matter. For each common accessory, note whether it can be installed before delivery, needs a scheduled tech appointment later, or can be added at the first service visit. Do not count an uninstalled promise as a completed sale.
Try one franchise for 30 days
- Pick one high-volume franchise.
- Give sales a short list of compatible delivery accessories for its top models.
- Ask service which repeat jobs lacked parts last month.
- Track offer rate, attachment, fill rate and installed gross weekly.
- Check whether the rider's delivery preferences survive the handoff to service.
- Keep what improves fit, delivery speed and ownership; stop stocking products only because they sold for a different franchise.
Frequently asked questions
Is aftermarket more profitable than OE?
The data cited here is revenue share, not margin, so it cannot answer that. Compare installed gross (cost, labor and returns included) by product before deciding.
Does an aftermarket accessory void the factory warranty?
Not by itself. The FTC says a warranty stays in effect with aftermarket parts, and the manufacturer must prove the part caused damage before denying coverage. Defective or improperly installed parts can lose coverage for the damage they cause.
Why does service run more aftermarket than sales?
Mix and job type. OE-loyal touring and premium brands account for roughly two-thirds of street accessory revenue at delivery, while tires, the biggest service category, are mostly aftermarket (PSB).
The bottom line
The goal is not to pick OE or aftermarket as a team. It is to put the right part in the right conversation at the right point in ownership. When sales and service plan together, the rider gets a more useful recommendation and the store makes a better-informed inventory decision.
Want to see how a structured, customer-facing presentation works at the desk? Book a Menu Lane demo.
About the author
Erik Smith is Sr. Product Operations Analyst at One Dealer Lane. He works with powersports, marine and RV dealers on connected sales, product and dealership data workflows.
Sources
- Powersports Business – OE vs. Aftermarket: Which side is winning?, Danny Orendain (Sept. 29, 2026; Lightspeed DMS data)
- Powersports Business – Lightspeed shares aftermarket parts data (Dec. 20, 2024)
- RideNow Group, Inc. – Second Quarter 2026 Financial Results, SEC Form 8-K Ex. 99.1 (Aug. 11, 2026)
- Federal Trade Commission – Auto Warranties and Auto Service Contracts
- Motorcycle & Powersports News – Your Parts Department Is Losing Sales It Should Be Winning, Quinton Rico (Apr. 20, 2026)
Back to Top
Get more from every deal
Sign up for a free trial and start driving higher gross this month. No commitment, just results.
(877) 421-0135